ASE VASP convergence test

Before doing real calculations, several parameters (e.g. energy cut-off, k-points, lattice, …) must be checked to ensure the quality of calculations. This article provides sciripts about convergence test based on ASE (version >= 3.14.0) and VASP 5.4.1. Different styles will be adopted to exemplify different ase-vasp features.

ENCUT test

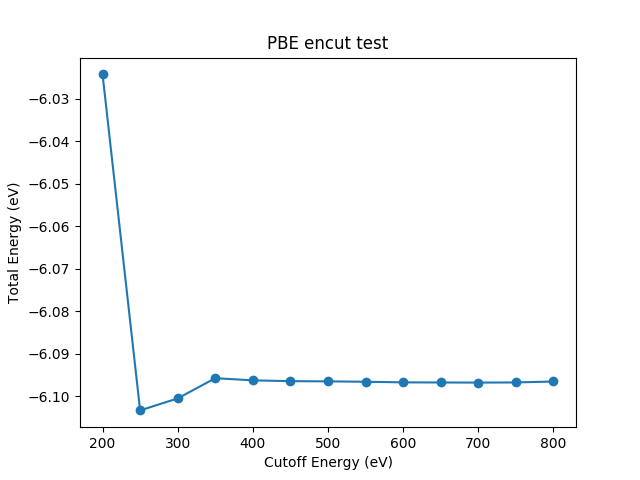
ENCUT (energy cut-off) test requires a series of total energy calculations on various ENCUT values

1
2
3
4
5
6
7
8
9
10
11
12
13
14
15
16
17
18
19
20
21
22
23
24
25
26
27
28
29
30
31
32
33
34
35
36
37
38
39
40
41
42
43
44
45
46
47
48
49
50
51
52
import os
import numpy as np
import matplotlib.pyplot as plt
from ase.build import bulk
from ase.calculators.vasp import Vasp
metal_symbol = 'Pt'
structure = 'fcc'
a0 = 3.98
metal = bulk(metal_symbol, structure, a=a0)
encuts = [encut for encut in range(200, 840, 50)] # 200~800
energies = []
for index, encut in enumerate(encuts):
vasp_directory = '{:0>2d}.encut-{}'.format(index, encut)
if not os.path.exists(vasp_directory):
os.makedirs(vasp_directory)
os.chdir(vasp_directory)
calculator = Vasp(xc='PBE', kpts=(12, 12, 12),
encut=encut,
ismear=-5,
lreal=False, lcharg=False, lwave=False
)
metal.set_calculator(calculator)
energy = metal.get_potential_energy()
energies.append(energy)
print '{:20s}: {:10.3f}'.format(vasp_directory, energy)
os.chdir(os.path.dirname(os.getcwd())) # back to root directory
plt.plot(encuts, energies, '-o')
plt.xlabel('Cutoff Energy (eV)')
plt.ylabel('Total Energy (eV)')
plt.title('PBE encut test')
plt.savefig('encut.png')
plt.close()
'''
00.encut-200 : -6.024
01.encut-250 : -6.103
02.encut-300 : -6.101
03.encut-350 : -6.096
04.encut-400 : -6.096
05.encut-450 : -6.096
06.encut-500 : -6.097
07.encut-550 : -6.097
08.encut-600 : -6.097
09.encut-650 : -6.097
10.encut-700 : -6.097
11.encut-750 : -6.097
12.encut-800 : -6.097
'''

If there is a problem with generating figures (_tkinter.TclError: couldn't connect to display "localhost:11.0"), the following code should be added before matplotlib is used

1
2
import matplotlib
matplotlib.use('Agg')

For ENCUT test, the choice of k-points does not affect the convergence trend of ENCUT. A moderate k-points would be fine. When ENCUT reaches 400 eV, the energy difference between this point and previous point is less than 1 meV/atom. Then 400 eV energy cut-off can be choosen for further calculation. This criterion depends on your demand. Generally, I like to create different directories for different calculations, since label feature is not currently supported in ase-vasp calculator. Someone is working on VASP with FileIOCalculator. But it takes time to make changes, because the ase-vasp calculator is used by a large number of people and small changes can affect many users.
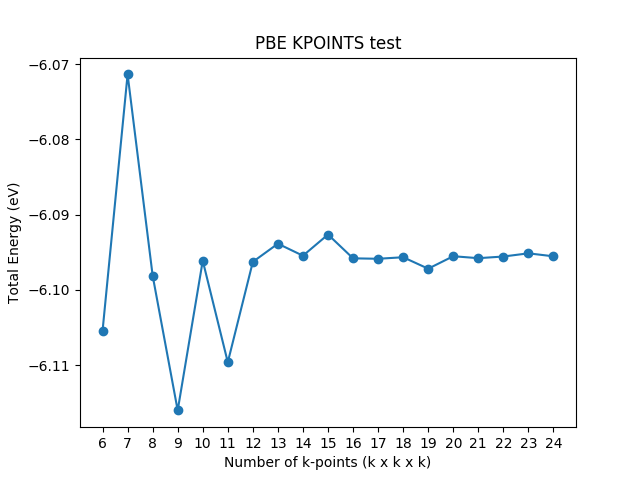
k-points test

The strategy for k-points test is the same as ENCUT test and the difference lies in loop variable.

1
2
3
4
5
6
7
8
9
10
11
12
13
14
15
16
17
18
19
20
21
22
23
24
25
26
27
28
29
30
31
32
33
34
35
36
37
38
39
40
41
42
43
44
45
46
47
48
49
50
51
52
53
54
55
56
57
58
59
import os
import numpy as np
import matplotlib.pyplot as plt
from ase.build import bulk
from ase.calculators.vasp import Vasp
metal_symbol = 'Pt'
structure = 'fcc'
a0 = 3.98
metal = bulk(metal_symbol, structure, a=a0)
k_points = [k for k in range(6, 25, 1)]
energies = []
for index, k in enumerate(k_points):
vasp_directory = '{:0>2d}.kpt-{}'.format(index, k)
if not os.path.exists(vasp_directory):
os.makedirs(vasp_directory)
os.chdir(vasp_directory)
calculator = Vasp(xc='PBE', kpts=(k, k, k),
encut=400,
ismear=-5,
lreal=False, lcharg=False, lwave=False
)
metal.set_calculator(calculator)
energy = metal.get_potential_energy()
energies.append(energy)
print '{:20s}: {:10.3f}'.format(vasp_directory, energy)
os.chdir(os.path.dirname(os.getcwd())) # back to root directory
plt.plot(k_points, energies, '-o')
plt.xlabel('Number of k-points (k x k x k)')
plt.ylabel('Total Energy (eV)')
plt.title('PBE KPOINTS test')
plt.savefig('kpts.png')
plt.close()
'''
00.kpt-6 : -6.105
01.kpt-7 : -6.071
02.kpt-8 : -6.098
03.kpt-9 : -6.116
04.kpt-10 : -6.096
05.kpt-11 : -6.110
06.kpt-12 : -6.096
07.kpt-13 : -6.094
08.kpt-14 : -6.095
09.kpt-15 : -6.093
10.kpt-16 : -6.096
11.kpt-17 : -6.096
12.kpt-18 : -6.096
13.kpt-19 : -6.097
14.kpt-20 : -6.096
15.kpt-21 : -6.096
16.kpt-22 : -6.096
17.kpt-23 : -6.095
18.kpt-24 : -6.096
'''

Lattice test

Four types of lattice test are given here.
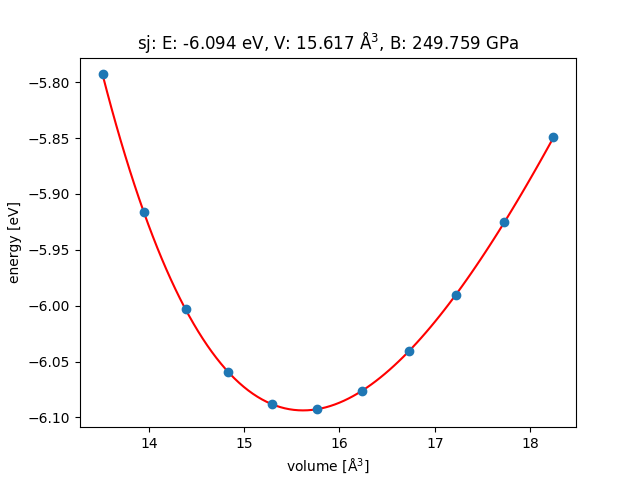
Pt

Lattice test of FCC metal (e.g. Pt) is easy to perform with only one variable needed to be considered. First, you need to perform a series of total energy calculations at different lattice constants. Then, fit equation of state. Finally, optimised lattice constant can be found.
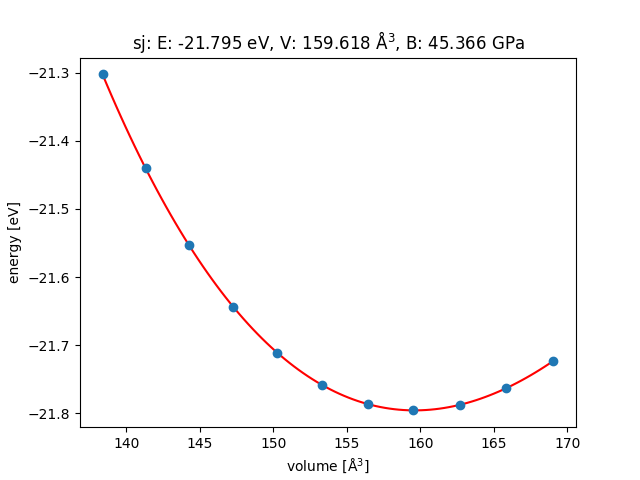
1
2
3
4
5
6
7
8
9
10
11
12
13
14
15
16
17
18
19
20
21
22
23
24
25
26
27
28
29
30
31
32
33
34
35
36
37
38
39
40
41
42
43
44
45
46
47
48
49
50
51
52
53
54
55
56
57
58
59
60
61
62
63
64
import os
import numpy as np
from ase.build import bulk
from ase.calculators.vasp import Vasp
from ase.eos import EquationOfState
metal_symbol = 'Pt'
structure = 'fcc'
a0 = 3.98
a_array = np.linspace(a0*0.95, a0*1.05, 11)
volumes = []
energies = []
print '{} - PBE - lattice test'.format(metal_symbol)
print 'directory volume(A^3) energy(eV)'
for index, a in enumerate(a_array):
vasp_directory = '{:0>2d}.lattice-{:.3f}'.format(index, a)
if not os.path.exists(vasp_directory):
os.makedirs(vasp_directory)
os.chdir(vasp_directory)
metal = bulk(metal_symbol, structure, a=a)
calculator = Vasp(xc='PBE', kpts=(21, 21, 21),
encut=400,
ismear=-5, # tetrahedron method with Bloechl corrections
lreal=False, lcharg=False, lwave=False
)
metal.set_calculator(calculator)
volume = metal.get_volume()
energy = metal.get_potential_energy()
volumes.append(volume)
energies.append(energy)
print '{:20s}: {:10.3f} {:10.3f}'.format(vasp_directory, volume, energy)
os.chdir(os.path.dirname(os.getcwd())) # back to root directory
eos = EquationOfState(volumes, energies)
v0, e0, B = eos.fit()
eos.plot('eos.png')
a0 = (4*v0) ** (1.0/3)
print 'v0: {:5.2f}'.format(v0)
print 'a0: {:5.2f}'.format(a0)
'''
Pt - PBE - lattice test
directory volume(A^3) energy(eV)
00.lattice-3.781 : 13.513 -5.793
01.lattice-3.821 : 13.944 -5.916
02.lattice-3.861 : 14.385 -6.003
03.lattice-3.900 : 14.834 -6.060
04.lattice-3.940 : 15.293 -6.088
05.lattice-3.980 : 15.761 -6.093
06.lattice-4.020 : 16.239 -6.076
07.lattice-4.060 : 16.726 -6.041
08.lattice-4.099 : 17.223 -5.990
09.lattice-4.139 : 17.729 -5.926
10.lattice-4.179 : 18.246 -5.849
v0: 15.62
a0: 3.97
'''

MoS2

Structure optimization has to be done to get energy miminum, otherwise errors would be large.

1
2
3
4
5
6
7
8
9
10
11
12
13
14
15
16
17
18
19
20
21
22
23
24
25
26
27
28
29
30
31
32
33
34
35
36
37
38
39
40
41
42
43
44
45
46
47
48
49
50
51
52
53
54
55
56
57
58
59
60
61
62
63
64
65
66
67
68
69
70
71
72
73
74
75
76
77
78
79
80
81
82
83
84
85
import numpy as np
import matplotlib
matplotlib.use('Agg')
import os
from ase.build import mx2
from ase.calculators.vasp import Vasp
from ase.eos import EquationOfState
atoms_symbol = "MoS2"
atoms_kind = "2H"
a_guess = 3.12
atoms = mx2(atoms_symbol, atoms_kind, a=a_guess, thickness=3.19, vacuum=7.5)
h = atoms.get_cell_lengths_and_angles()[2]
print 'MoS2-cell-c : {:.3f}'.format(h)
lattice_a = np.linspace(a_guess*0.95, a_guess*1.05, 11)
volumes = []
energies = []
for index, a in enumerate(lattice_a):
vasp_directory = '{:0>2d}.lattice-{:.3f}'.format(index, a)
if not os.path.exists(vasp_directory):
os.makedirs(vasp_directory)
os.chdir(vasp_directory)
atoms = mx2(atoms_symbol, atoms_kind, a=a, thickness=3.19, vacuum=7.5)
calculator = Vasp(xc='PBE', kpts=(6, 6, 1), encut=400,
ismear=0, sigma=0.05,
ibrion=1, nsw=200,
lreal=False, lcharg=False, lwave=False
)
atoms.set_calculator(calculator)
volume = atoms.get_volume()
energy = atoms.get_potential_energy()
volumes.append(volume)
energies.append(energy)
print '{:20s}: {:10.3f} {:10.3f}'.format(vasp_directory, volume, energy)
os.chdir(os.path.dirname(os.getcwd())) # back to root directory
eos = EquationOfState(volumes, energies)
v0, e0, B = eos.fit()
print "v0 = {:.3f}".format(v0)
a0 = np.sqrt( (2*v0) / (h*np.sqrt(3)))
print "a0 = {:.3f}".format(a0)
eos.plot('{}-{}-eos.png'.format(atoms_symbol,atoms_kind))
print "Relaxtion after getting a0"
vasp_directory = 'opt'
if not os.path.exists(vasp_directory):
os.makedirs(vasp_directory)
os.chdir(vasp_directory)
atoms = mx2(atoms_symbol, atoms_kind, a=a0, thickness=3.19, vacuum=7.5)
calculator = Vasp(xc='PBE', kpts=(6, 6, 1), encut=400,
ismear=0, sigma=0.05,
ibrion=1, nsw=200,
lreal=False, lcharg=False, lwave=False
)
atoms.set_calculator(calculator)
final_energy = atoms.get_potential_energy()
thickness = atoms[1].z - atoms[2].z
print "thickness = {:.3f}".format(thickness)
os.chdir(os.path.dirname(os.getcwd())) # back to root directory
'''
MoS2-cell-c : 18.190
00.lattice-2.964 : 138.395 -21.303
01.lattice-2.995 : 141.324 -21.440
02.lattice-3.026 : 144.283 -21.553
03.lattice-3.058 : 147.274 -21.643
04.lattice-3.089 : 150.294 -21.711
05.lattice-3.120 : 153.346 -21.758
06.lattice-3.151 : 156.428 -21.786
07.lattice-3.182 : 159.541 -21.795
08.lattice-3.214 : 162.685 -21.787
09.lattice-3.245 : 165.859 -21.763
10.lattice-3.276 : 169.064 -21.723
v0 = 159.618
a0 = 3.183
Relaxtion after getting a0
thickness = 3.127
'''

2H-MoS2-opt

TiO2

It’s convenient to check structure with a calculate flag. traj file is used for data analysis. The chance of making mistakes will be reduced if caculation part and analysis part are seperated.

1
2
3
4
5
6
7
8
9
10
11
12
13
14
15
16
17
18
19
20
21
22
23
24
25
26
27
28
29
30
31
32
33
34
35
36
37
38
39
40
41
42
43
44
45
46
47
48
49
50
51
52
53
54
55
56
57
58
59
60
61
62
63
64
65
66
67
68
69
70
71
72
73
74
from sys import argv
import numpy as np
import os
from ase.spacegroup import crystal
from ase.io import read, write, Trajectory
from ase.calculators.vasp import Vasp
from ase.visualize import view
calculate = False or len(argv) > 1
# 10.1021/acs.jpcc.5b11625
a0 = 4.60
c0 = 2.96
rutile = crystal(['Ti', 'O'], basis=[(0 ,0, 0), (0.30496, 0.30496, 0)], spacegroup=136, cellpar=[a0, a0, c0, 90, 90, 90])
if not calculate:
print rutile.cell
#rutile.write('rutile.cif')
view(rutile)
quit()
# https://wiki.fysik.dtu.dk/ase/tutorials/lattice_constant.html
traj = Trajectory('rutile.traj', 'w')
calculator = Vasp(xc='PBE', kpts=(6, 6, 6),
encut=400,
ismear=0, sigma=0.05,
lreal=False, lcharg=False, lwave=False
)
eps = 0.01
index = 0
for a in a0 * np.linspace(1 - eps, 1 + eps, 3):
for c in c0 * np.linspace(1 - eps, 1 + eps, 3):
vasp_directory = '{:0>2d}.a-{:.3f}-c-{:.3f}'.format(index, a, c)
if not os.path.exists(vasp_directory):
os.makedirs(vasp_directory)
os.chdir(vasp_directory)
slab = crystal(['Ti', 'O'], basis=[(0 ,0, 0), (0.30496, 0.30496, 0)], spacegroup=136, cellpar=[a, a, c, 90, 90, 90])
slab.set_calculator(calculator)
print '{:.3f} {:.3f} {:.3f}'.format(a, c, slab.get_potential_energy())
os.chdir(os.path.dirname(os.getcwd())) # back to root directory
traj.write(slab)
index += 1
configs = read('rutile.traj@:')
energies = [config.get_potential_energy() for config in configs]
a = np.array([config.cell[0, 0] for config in configs])
c = np.array([config.cell[2, 2] for config in configs])
functions = np.array([a**0, a, c, a**2, a * c, c**2])
p = np.linalg.lstsq(functions.T, energies)[0]
p0 = p[0]
p1 = p[1:3]
p2 = np.array([(2 * p[3], p[4]),
(p[4], 2 * p[5])])
a0, c0 = np.linalg.solve(p2.T, -p1)
print 'a0: {:.3f}'.format(a0)
print 'c0: {:.3f}'.format(c0)
'''
4.554 2.930 -52.729
4.554 2.960 -52.787
4.554 2.990 -52.811
4.600 2.930 -52.830
4.600 2.960 -52.869
4.600 2.990 -52.878
4.646 2.930 -52.883
4.646 2.960 -52.907
4.646 2.990 -52.900
a0: 4.659
c0: 2.963
'''

ZrO2

For system containing more than 2 variables, it’s suggested to do a full-relaxtion (optimising both cell and atoms) with high accuracy

1
2
3
4
5
6
7
8
9
10
11
12
13
14
15
16
17
18
19
20
21
22
23
24
25
26
27
28
29
30
31
32
33
34
35
36
37
38
39
40
41
42
43
44
45
46
47
48
49
50
51
52
53
54
55
56
57
58
59
from sys import argv
import numpy as np
from ase.spacegroup import crystal
from ase.build import surface, sort
from ase.constraints import FixAtoms
from ase.io import write
from ase.calculators.vasp import Vasp
from ase.visualize import view
calculate = False or len(argv) > 1
"""
Kudoh Y, Takeda H, Arashi H
Physics and Chemistry of Minerals 13 (1986) 233-237
In situ determination of crystal structure for high pressure
phase of ZrO2 using a diamond anvil and single crystal X-ray
diffraction method
Sample: P = 15 kbar
_database_code_amcsd 0007415
5.120 5.216 5.281 90 99.01 90 P2_1/c
atom x y z Biso
Zr .2754 .0395 .2086 1.17
O1 .0710 .3396 .3380 .78
O2 .4551 .7607 .4855 1.02
"""
a = 5.120
b = 5.216
c = 5.281
coordinate = [
(0.27540, 0.03950, 0.20860),
(0.07100, 0.33960, 0.33800),
(0.45510, 0.76070, 0.48550),
]
slab = crystal(['Zr', 'O', 'O'], basis=coordinate, spacegroup=14, cellpar=[a, b, c, 90, 99.01, 90])
if not calculate:
view(slab)
quit()
slab = sort(slab)
calculator = Vasp(xc='PBE', kpts=(6, 6, 6), setups={'Zr': '_sv'},
encut=400, ediff=1E-5,
isif=3, prec='Accurate',
ismear=0, sigma=0.05,
ibrion=1, nsw=400, ediffg=-0.001,
lreal=False, lcharg=False, lwave=False
)
slab.set_calculator(calculator)
final_energy = slab.get_potential_energy()
print 'ZrO2-unit-cell-relax : {:10.3f}'.format(final_energy)
print 'ZrO2-unit-cell-parameters : {}'.format(slab.get_cell_lengths_and_angles())
'''
ZrO2-unit-cell-relax : -115.169
ZrO2-unit-cell-parameters : [ 5.11717084 5.23505373 5.27540102 90. 99.10005442 90. ]
'''